How Much Does Solar Save Per Month in 2026? Real Numbers by State

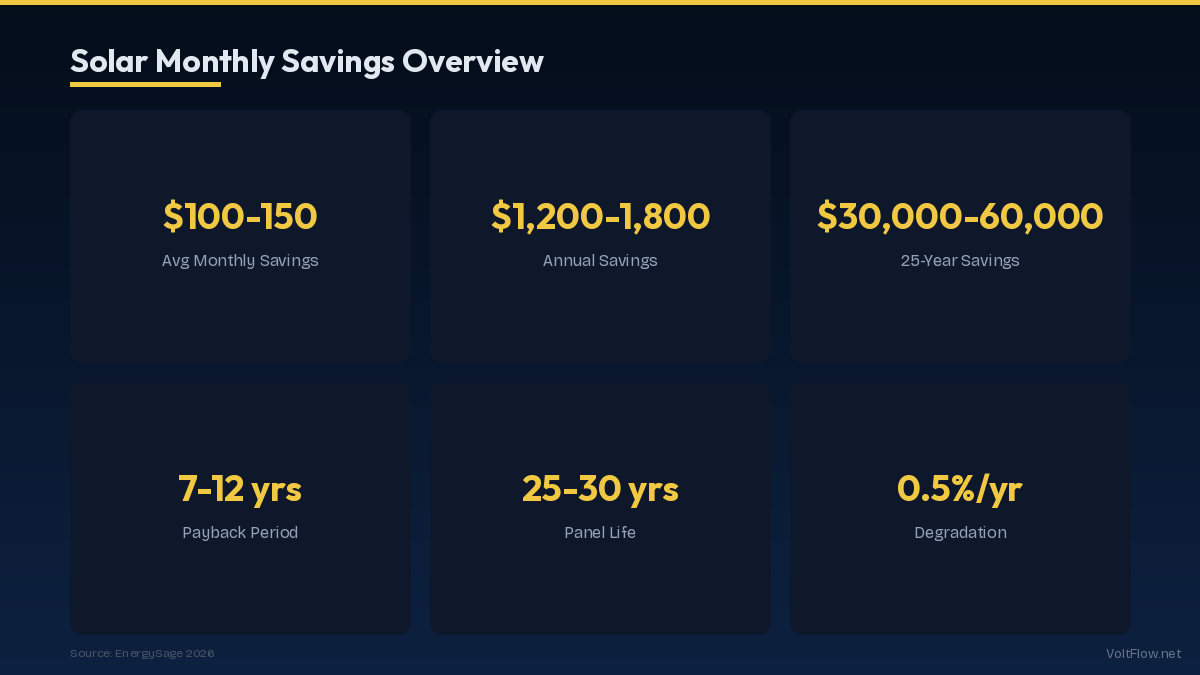
The average American homeowner with solar panels saves $100-$180 per month on electricity, depending on system size, location, and local rates. In high-rate states like California and Massachusetts, monthly savings reach $200-$300. Over the 25-30 year lifespan of a solar system, total savings range from $30,000 to $90,000. This guide calculates exact monthly savings by state, system size, and rate structure so you can project your personal return.
Average Monthly Solar Savings by State
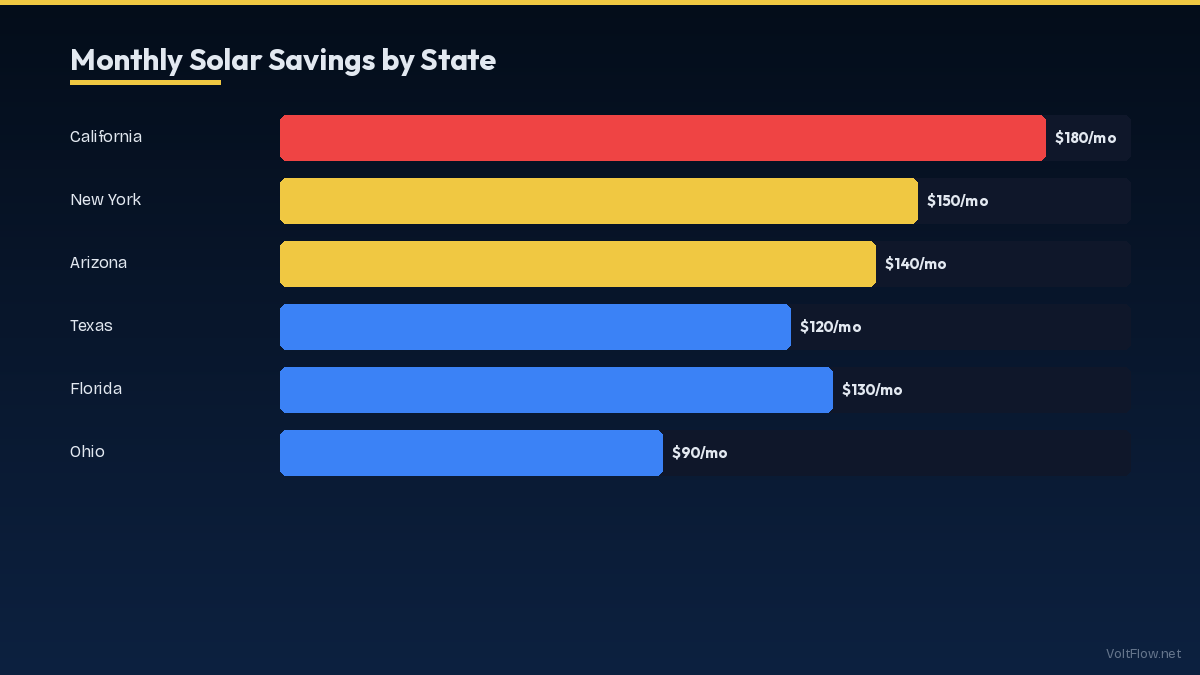
Solar savings depend on two primary factors: how much electricity your panels produce and the retail rate you would otherwise pay your utility for that electricity. States with high electricity rates and abundant sunshine produce the highest savings, while states with low rates or limited sun produce less dramatic but still positive returns. California leads in monthly savings at $180-$300 per month for a typical 8 kW system. The state high electricity rates of $0.28-$0.35 per kWh combined with 5.5-6.0 peak sun hours create a powerful savings combination. An 8 kW system in Southern California produces approximately 12,000-13,000 kWh per year, offsetting $3,360-$4,550 annually or $280-$380 per month. Even Northern California with slightly less sun saves $220-$300 per month due to equally high rates. Massachusetts and Connecticut save $170-$250 per month despite having only 4.0-4.5 peak sun hours. The high electricity rates of $0.26-$0.30 per kWh compensate for lower production. An 8 kW system produces about 9,500-10,500 kWh per year in these states, but each kWh saves more because rates are so high. The SMART incentive program in Massachusetts adds additional income on top of the bill savings. Arizona and Nevada save $150-$200 per month by combining moderate electricity rates of $0.13-$0.16 per kWh with exceptional sunshine of 6.0-6.5 peak sun hours. An 8 kW system in Phoenix produces 13,500-14,500 kWh per year. The high production compensates for lower rates, and the surplus generation credits provide additional value. Texas saves $120-$170 per month with moderate rates and good sunshine. The deregulated electricity market in most of Texas means rates fluctuate, and solar provides a hedge against rate increases that have averaged 3-5 percent per year in the state. Florida saves $110-$160 per month. While Florida sunshine is excellent at 5.0-5.5 peak sun hours, the relatively moderate electricity rates of $0.13-$0.15 per kWh limit monthly savings compared to high-rate states. However, Florida exempts solar from both sales tax and property tax, which improves the net financial return. States in the Midwest and Northern Plains save $80-$120 per month with lower sun hours of 4.0-4.5 and lower electricity rates of $0.12-$0.15 per kWh. While savings per month are lower, system costs are also lower in these regions, and the payback period remains reasonable at 7-10 years. The Pacific Northwest saves $70-$100 per month due to low electricity rates of $0.10-$0.12 per kWh (thanks to hydropower) and lower sun hours. Oregon and Washington have the longest solar payback periods in the continental US at 10-14 years, though the systems still produce positive lifetime returns.
How System Size Affects Monthly Savings
Your solar system size directly determines your monthly production and therefore your savings. Bigger systems save more per month but cost more upfront, so the optimal size balances your electricity consumption against your budget and available roof space. A 4 kW system is the minimum practical residential installation. It produces 4,800-6,500 kWh per year depending on location, offsetting approximately 40-60 percent of the average home electricity consumption. Monthly savings range from $50-$120. This size suits small homes, apartments with limited roof access, or homeowners on a tight budget. System cost runs $11,000-$14,000 before the 30 percent federal tax credit, dropping to $7,700-$9,800 after the credit. Payback period is 5-9 years depending on local rates. A 6 kW system is the most popular residential size for homes under 2,000 square feet. It produces 7,200-9,800 kWh per year, offsetting 65-85 percent of average consumption. Monthly savings range from $80-$170. System cost is $16,500-$19,500 before the credit and $11,550-$13,650 after. This size offers the best balance of savings and affordability for most homes with moderate electricity consumption. An 8 kW system covers the full electricity needs of most average homes consuming 10,500 kWh per year. Annual production of 9,600-13,000 kWh may exceed consumption in sunnier locations. Monthly savings range from $100-$220. System cost is $22,000-$25,000 before credit and $15,400-$17,500 after. This is the ideal size for homeowners who want to eliminate their electricity bill entirely and build credits for future EV charging. A 10-12 kW system targets larger homes or homes planning significant electrification like EV charging and heat pump installation. Annual production of 12,000-19,500 kWh often exceeds current consumption, building a credit bank for future needs. Monthly savings of $130-$300 depend on system size and local rates. System cost of $27,500-$36,000 before credit drops to $19,250-$25,200 after. This size requires 600-750 square feet of suitable roof space. Oversizing beyond your current consumption makes sense if you plan to add an EV within the next few years, as the additional 3,000-5,000 kWh of annual charging demand will consume the surplus. The 30 percent federal tax credit applies to the full system cost at installation, so maximizing your system size now maximizes the credit value. Adding panels later as a separate project incurs additional permitting and mobilization costs that increase the effective per-watt price compared to including them in the original installation.
Net Metering and How It Affects Your Savings
Net metering policy determines how much credit you receive for surplus solar electricity exported to the grid, and it dramatically affects your monthly savings calculation. Understanding your state net metering rules is essential for accurate savings projections. Full retail net metering credits your exported solar electricity at the same rate you pay for imported electricity. If you pay $0.18 per kWh and export surplus solar at midday, you receive a $0.18 credit that offsets an equal amount of electricity you import at night. Under full retail net metering, every kWh your panels produce has the same value regardless of when you use it. This is the most favorable policy for solar owners and exists in approximately 30 states. Your monthly bill shows net consumption: total imported minus total exported, times the retail rate. In the best months, your bill is zero or you build up credits that carry forward. Reduced or net billing credits your exports at a wholesale or avoided-cost rate that is lower than the retail rate you pay. California NEM 3.0 and several other states have moved to this model, crediting exports at $0.05-$0.10 per kWh while you pay $0.25-$0.35 for imports. Under net billing, the timing of your solar production versus consumption matters enormously. Electricity you consume directly from your panels saves the full retail rate, while electricity you export earns a fraction of that rate. Monthly savings under net billing are typically 20-40 percent lower than under full retail net metering for the same system size, because much of your solar production occurs during midday when you may not be home to consume it. Battery storage becomes much more valuable under net billing because it allows you to store midday surplus and use it during evening peak hours at full retail value instead of exporting at reduced credits. A 10 kWh battery adds $8,000-$12,000 to your system cost but can recover $50-$100 per month in additional savings by shifting your surplus to peak hours. Time-of-use net metering combines TOU rates with net metering credits. Your exports during peak hours earn peak-rate credits while imports during off-peak hours cost less. If your solar production coincides with peak pricing of 4-9 PM, which west-facing panels can partially achieve, TOU net metering can actually produce higher monthly savings than flat-rate net metering. Some states are eliminating or reducing net metering for new solar installations. If you are considering solar, understanding your state current and planned net metering policy is critical for accurate savings projections.
First-Year vs Long-Term Monthly Savings
Solar savings are not static, they grow over time as electricity rates increase while your solar production cost remains fixed at zero after the system is paid off. Understanding this trajectory reveals why solar is an even better investment than first-year savings suggest. In year one, your monthly savings depend on your system production and current electricity rate. For a typical 8 kW system in a state with $0.16 per kWh electricity, first-year monthly savings average approximately $130. This is the lowest your savings will ever be because electricity rates increase over time. By year five, assuming a conservative 2.5 percent annual rate increase, your effective electricity rate rises to $0.177 per kWh. Your solar system produces slightly less due to panel degradation of approximately 0.5 percent per year, but the rate increase more than compensates. Monthly savings grow to approximately $145, an 11 percent increase over year one with no additional investment on your part. By year ten, the effective rate reaches $0.20 per kWh and monthly savings grow to approximately $162. Your system has produced about 95 percent of its original output due to cumulative degradation, but the 25 percent rate increase overwhelms the 5 percent production loss. By year 15, rates reach $0.23 per kWh and monthly savings hit approximately $180. If you financed the system with a solar loan, you have likely paid off the loan by this point, and the full monthly savings flow directly to your household budget rather than partially servicing debt payments. By year 20, rates reach $0.26 per kWh and monthly savings approach $200. Your panels still produce approximately 90 percent of their original output. You have saved approximately $35,000 cumulative by this point and have 5-10 more years of production remaining on panels warranted for 25-30 years. By year 25, the end of most panel warranties, rates may reach $0.30 per kWh with monthly savings of $215. Cumulative savings reach $45,000-$55,000 depending on the rate escalation path. Many panels continue producing at 80-85 percent capacity well past their 25-year warranty, providing additional years of savings. Lifetime cumulative savings for a typical 8 kW system range from $45,000 in low-rate states to $90,000 in high-rate states. Against an after-credit system cost of $15,000-$18,000, the return on investment is 3-5 times the original investment. No conventional savings account or bond investment matches this return over the same period, which is why financial advisors increasingly recommend solar as a component of household financial planning alongside traditional investments.
Calculating Your Specific Monthly Savings
To calculate your personal monthly savings, follow this four-step process using your actual electricity data and local solar resource information. Step one: determine your annual electricity consumption. Pull your last 12 monthly electric bills and add up the total kWh. The average American home uses 10,500 kWh per year, but your actual consumption may range from 6,000 to 20,000 kWh depending on home size, climate, and whether you have electric heating or cooling. If you plan to add an EV charger within the next few years, add 3,000-5,000 kWh to your annual total. Step two: determine your system size and expected production. Use the NREL PVWatts calculator at pvwatts.nrel.gov to enter your address, roof orientation, and desired system size. PVWatts returns estimated annual production accounting for your specific latitude, weather patterns, and system losses. For a quick estimate, multiply your system size in kW by your location peak sun hours by 365 by 0.80 (accounting for system losses). An 8 kW system in a location with 5 peak sun hours produces approximately 8 times 5 times 365 times 0.80 equals 11,680 kWh per year. Step three: determine the value of each kWh. Under full retail net metering, use your all-in electricity rate (total bill divided by total kWh). Under net billing, calculate separately: self-consumed kWh at full retail rate and exported kWh at the export credit rate. Most residential systems self-consume 30-50 percent of production directly, with the remainder exported. Step four: calculate monthly savings. Multiply annual production by the per-kWh value, then divide by 12. For our 8 kW example producing 11,680 kWh at $0.16 per kWh under full retail net metering: 11,680 times $0.16 equals $1,869 per year or $156 per month. If your monthly savings do not eliminate your electric bill entirely, you will still pay the utility for any consumption beyond what your panels produce, plus any fixed monthly customer charges of $5-$15 that apply regardless of consumption. Many homeowners find that their solar system covers 85-100 percent of consumption, leaving only the small fixed charge as a remaining monthly payment.
Maximizing Your Monthly Savings: Practical Tips
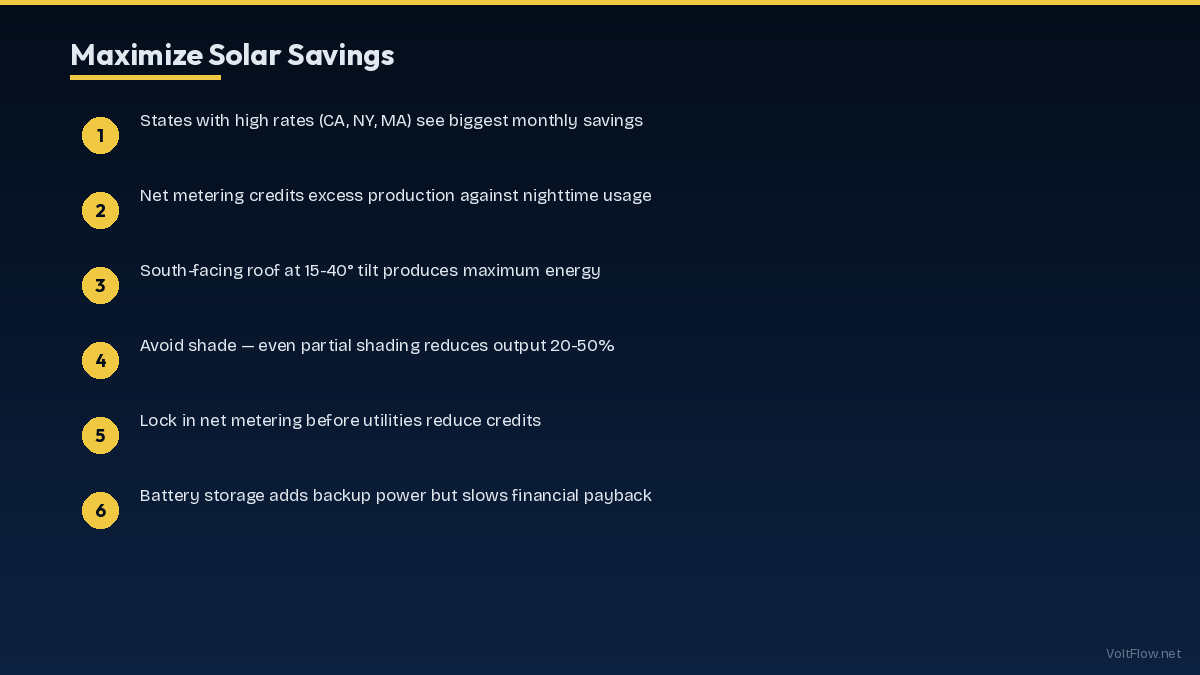
Several strategies can increase your monthly solar savings beyond the baseline calculation, some at no additional cost and others requiring modest investment that pays back quickly. Shifting consumption to solar production hours is the simplest free strategy. Run your dishwasher, washing machine, and pool pump during midday when your panels are producing at peak output. Every kWh you consume directly from your panels avoids the export and reimport losses that occur under net billing, where exports are credited at lower rates than imports cost. Even under full retail net metering, direct consumption avoids the small transmission losses that occur during export. Time-of-use rate optimization can significantly boost savings if your utility offers TOU rates. In many TOU rate structures, solar production hours coincide with mid-peak or even peak pricing tiers, meaning each kWh your panels produce during these expensive hours saves more than a flat-rate kWh. Check with your utility about TOU rate options, switching from flat rate to TOU may increase your monthly savings by 10-20 percent. Energy efficiency improvements compound your solar savings because they reduce your total consumption, allowing your solar system to cover a larger percentage of your needs. The most impactful residential efficiency measures include sealing air leaks and adding insulation, which saves 15-25 percent of heating and cooling energy, upgrading to LED lighting throughout the home, and replacing aging appliances with Energy Star models. Every kWh you eliminate through efficiency is a kWh your solar system no longer needs to produce. Battery storage at $8,000-$15,000 installed adds complexity but can increase monthly savings by $50-$100 in markets with net billing or high TOU rate differentials. The battery stores midday surplus and discharges during evening peak hours when electricity costs the most. In California under NEM 3.0, a battery can nearly double the effective value of your solar exports by converting $0.05-$0.08 per kWh export credits into $0.30-$0.45 per kWh avoided imports. EV integration is the highest-impact addition to a solar home. If you can charge your EV during solar production hours using a Level 2 home charger, you effectively fuel your vehicle with free solar electricity instead of paying $0.16-$0.30 per kWh from the grid. For a typical EV consuming 4,000 kWh per year, this adds $640-$1,200 in annual fuel savings on top of your household solar savings, bringing total monthly savings from solar to $200-$350 when combined with EV fueling.