Electricity Rates UK 2026: Price Cap, Tariffs & Saving Guide

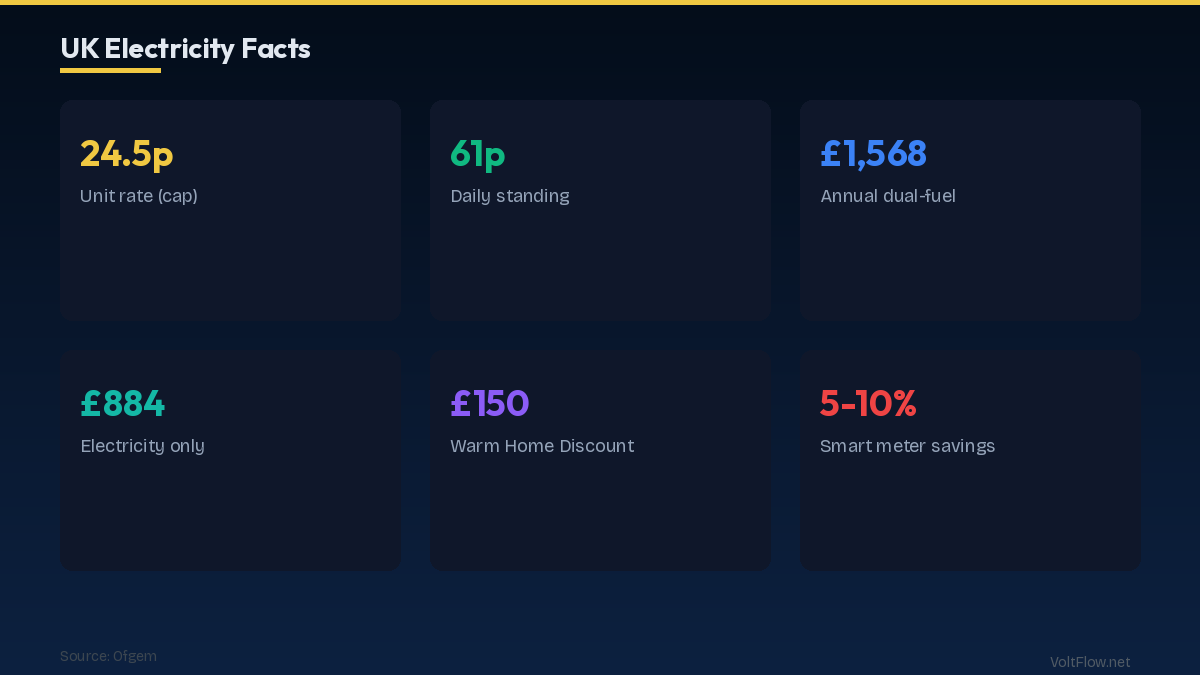
UK electricity prices in 2026 sit at approximately 24.5p per kWh under the Ofgem price cap, with a standing charge of 61p per day. The average UK household uses 2,700 kWh per year, resulting in an annual electricity bill of roughly £880-£920. Fixed-rate deals from suppliers can beat the cap, and Economy 7 off-peak rates drop to 10-15p/kWh overnight. This guide explains how UK electricity pricing works, compares tariff types, and shows you how to cut your bill.
Understanding the Ofgem Price Cap in 2026
The Ofgem energy price cap sets the maximum amount that suppliers can charge per unit of electricity and gas for customers on default or standard variable tariffs. In 2026, the electricity unit rate cap sits at approximately 24.5p per kWh with a daily standing charge of 61p. These figures are reviewed quarterly by Ofgem and adjusted based on wholesale energy costs, network charges, policy costs, and supplier operating margins. The price cap does not limit your total bill, it caps the per-unit rate. If you use more electricity than average, your bill will be higher than the typical figure Ofgem quotes. The cap applies to roughly 75 percent of UK households who are on their supplier default tariff because they have not actively switched to a fixed-rate deal. The remaining 25 percent are on fixed tariffs that may be above or below the cap depending on when they locked in their rate. The Ofgem typical household figure assumes annual consumption of 2,700 kWh for electricity and 11,500 kWh for gas. At 24.5p per kWh plus the standing charge, the typical annual electricity bill works out to approximately £883. Combined with gas at roughly 6.2p per kWh, the typical dual fuel bill is approximately £1,568 per year. These figures have come down significantly from the crisis peaks of 2022-2023 when the cap temporarily exceeded 34p per kWh for electricity, but remain substantially higher than the pre-crisis levels of 18-21p per kWh that prevailed before 2021. The wholesale energy market strongly influences the cap level. UK electricity wholesale prices are set by the marginal cost of generation, which is typically gas-fired power stations. Even though renewable energy now generates over 40 percent of UK electricity, the pricing mechanism means that gas prices still drive electricity costs for consumers. This is why government policy is shifting toward reform of the electricity market to decouple renewable generation costs from gas prices. Understanding the cap helps you evaluate whether fixed-rate deals offer genuine savings. If a supplier offers a fixed rate of 22p per kWh when the cap is 24.5p, you save 2.5p on every unit, which amounts to approximately £68 per year for the average household. If the cap drops below your fixed rate at the next quarterly review, you are locked into the higher rate until your fixed term ends.
Tariff Types: Standard Variable, Fixed, and Economy 7
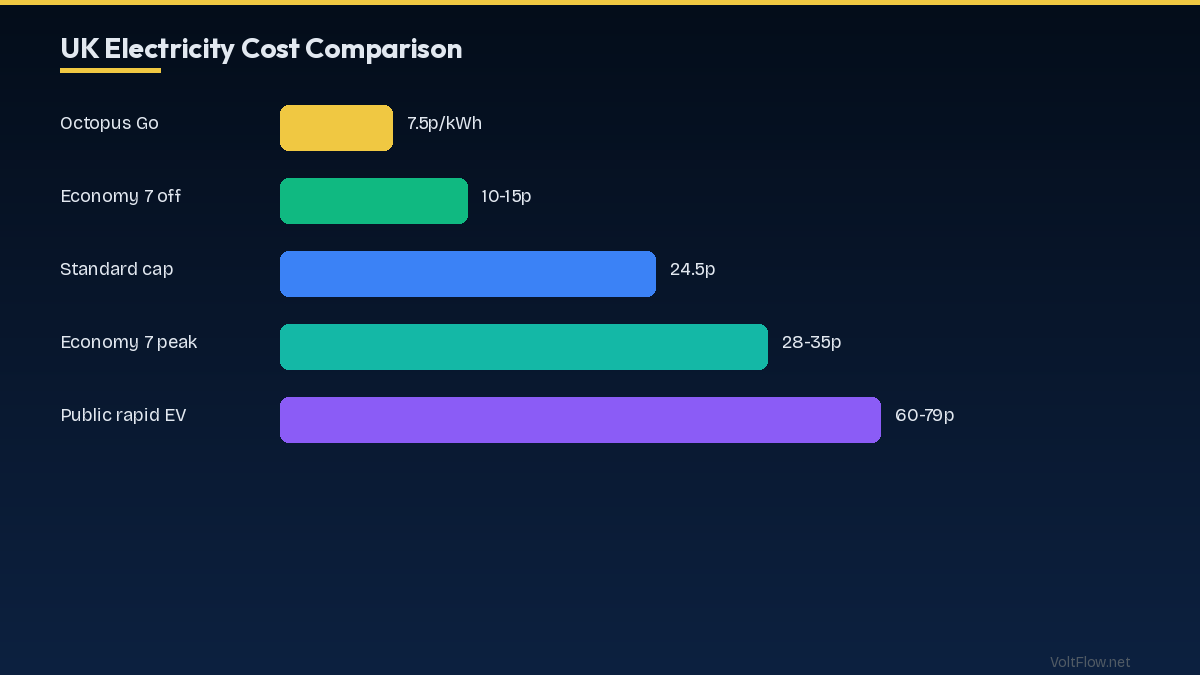
UK electricity customers can choose between several tariff structures, each suited to different usage patterns and risk preferences. Understanding the options helps you select the tariff that minimizes your annual cost. Standard Variable Tariffs or SVTs are the default tariff you land on when you do not actively choose a deal or when your fixed-rate deal expires. SVTs track the Ofgem price cap, meaning your rate changes quarterly as Ofgem adjusts the cap. The advantage is flexibility with no exit fees, so you can switch to a better deal at any time. The disadvantage is that SVTs are almost always the most expensive option because suppliers set SVT rates at or near the cap maximum. If you are on an SVT, switching to a competitive fixed deal typically saves £50-£150 per year. Fixed-rate tariffs lock your per-unit rate and standing charge for a set period, typically 12-24 months. You pay the same rate regardless of what happens to the Ofgem cap during your fixed term. In a rising market, fixed tariffs protect you from increases. In a falling market, you may be locked into a rate higher than the cap. Exit fees of £25-£50 per fuel may apply if you leave early, though many fixed deals are now exit-fee-free. The best time to lock in a fixed rate is when wholesale prices are low and the market expects future increases. Energy comparison sites like Uswitch, Compare the Market, and MoneySupermarket show available fixed deals alongside the current cap rate, making comparison straightforward. Economy 7 tariffs provide two electricity rates: a cheap off-peak rate of 10-15p per kWh during seven designated overnight hours, typically midnight to 7 AM, and an expensive peak rate of 28-35p per kWh during the remaining 17 hours. Economy 7 requires a specific two-register meter. The tariff saves money only if you use at least 40 percent of your electricity during the off-peak window. Households with storage heaters, overnight water heating, and EV charging benefit most. The average household using only 25 percent of electricity at night pays more on Economy 7 than on a flat-rate tariff. Prepayment meter customers pay slightly higher rates than direct debit customers, typically 1-2p per kWh more. The Ofgem cap includes separate, higher rates for prepayment customers. If you are on a prepayment meter and have no debt with your supplier, you can request a switch to a credit meter and access cheaper tariff options.
Regional Electricity Price Variations Across the UK
Electricity prices in the UK vary by region due to differences in network distribution costs, the distance electricity travels from generation to your home, and the age and condition of local distribution infrastructure. The UK is divided into 14 electricity distribution regions, each operated by a Distribution Network Operator or DNO. While the Ofgem price cap is set nationally, the actual per-unit rate within the cap varies by region because the network cost component differs. The difference between the cheapest and most expensive regions is typically 1-3p per kWh, which translates to £27-£81 per year for the average household. Southern England regions including South East, South, and South West tend to have slightly lower distribution costs due to proximity to major generation sources and newer infrastructure. Northern regions including North Scotland, North East, and North West tend to have slightly higher distribution costs due to longer transmission distances and the challenges of maintaining networks in rural and remote areas. The North Scotland region typically has the highest distribution charges in Great Britain due to the vast distances between relatively few customers. London has its own distinct pricing dynamic. The distribution network is operated by UK Power Networks and serves an extremely dense customer base. While the per-customer network cost is moderate, the high property values and congested infrastructure make maintenance and upgrades expensive. London electricity rates are typically in the middle of the national range. Northern Ireland operates under a separate regulatory framework with the Utility Regulator rather than Ofgem. Electricity prices in Northern Ireland have historically been higher than in Great Britain due to the smaller market, limited interconnection, and higher generation costs from the island's energy mix. Northern Ireland customers typically pay 2-5p per kWh more than the GB average, though this gap has narrowed with improved interconnection and renewable development. For customers choosing fixed-rate deals, regional pricing differences are already factored into the quoted rate. When comparing deals on switching sites, enter your postcode to see rates specific to your DNO region. The cheapest deal in London may be from a different supplier than the cheapest deal in Scotland.
How to Reduce Your Electricity Bill in 2026
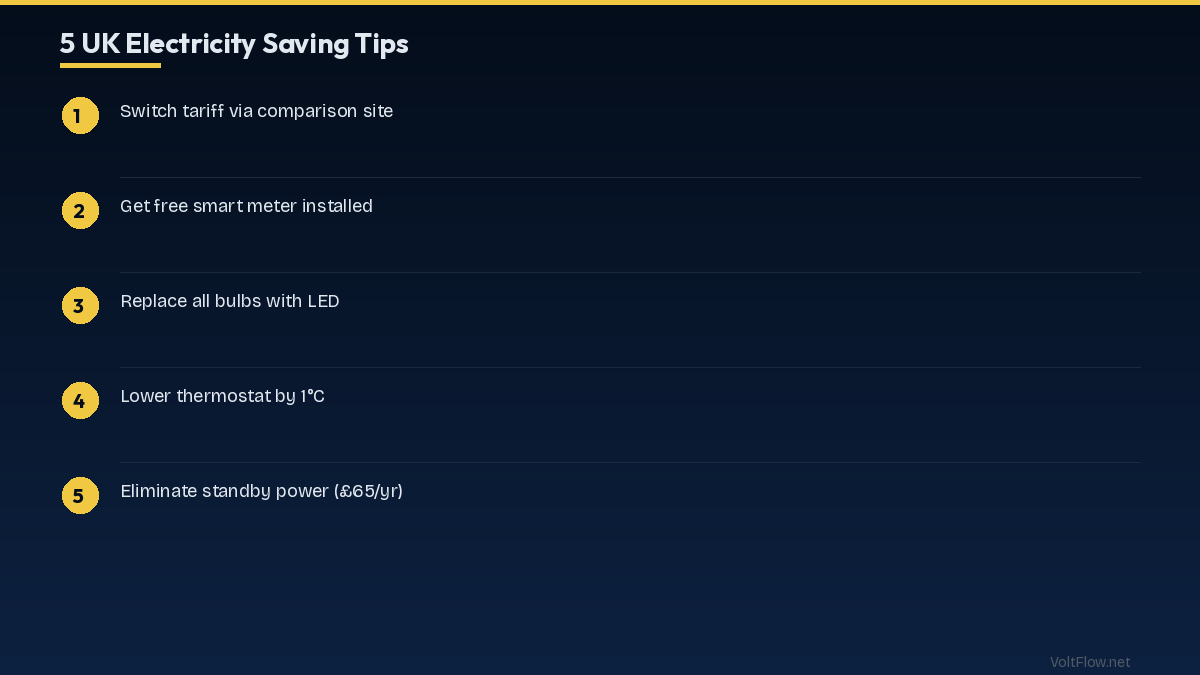
Reducing your electricity bill involves a combination of switching to a cheaper tariff, reducing consumption through efficiency measures, and shifting usage to cheaper time periods if you are on a time-of-use tariff. Switch supplier or tariff first because it requires zero investment and can save £50-£150 per year. Use comparison sites to check if a fixed deal beats your current rate. If you have been on the same tariff for more than 12 months, you are almost certainly overpaying. The switching process takes 2-3 weeks and is managed entirely by the new supplier. You do not need to contact your current supplier. LED lighting throughout your home saves £50-£100 per year compared to halogen or CFL bulbs. A typical UK home has 30-40 light fittings. Replacing all of them with LED bulbs at £2-£3 each costs £60-£120 and pays back within one year. LED bulbs last 15,000-25,000 hours compared to 2,000 hours for halogens, eliminating replacement hassle for a decade. Smart thermostats save £80-£150 per year on heating by learning your schedule and reducing heating when you are away or asleep. While this primarily saves gas, homes with electric heating including heat pumps benefit equally. Hive, Nest, and Tado are the most popular smart thermostats in the UK, costing £150-£250 including installation. Appliance efficiency upgrades focus on the biggest consumers. The tumble dryer is typically the most expensive single appliance to run at £60-£100 per year. A heat pump tumble dryer uses 60 percent less electricity than a condenser dryer, saving £40-£60 per year. The fridge-freezer runs 24 hours a day and costs £40-£70 per year. Replacing a 10-year-old model with an A-rated unit saves £20-£30 annually. Solar panels generate free electricity that directly reduces your grid consumption. A typical 4 kWp UK system produces 3,400-4,000 kWh per year, covering most of the average household consumption. After the Smart Export Guarantee payments for surplus electricity exported to the grid, annual savings range from £600-£900. The system cost of £5,000-£7,000 for a standard installation pays back in 6-9 years. Draught-proofing and insulation reduce the amount of electricity used for heating. Even homes with gas central heating use electricity for the boiler pump, controls, and supplementary electric heaters. Homes with heat pumps or direct electric heating see dramatic savings from improved insulation because the heat pump runs fewer hours when heat loss is reduced.
Smart Meters and Energy Monitoring
Smart meters are now installed in over 30 million UK homes and provide real-time visibility into your electricity consumption that manual meters cannot match. Understanding how to use your smart meter data effectively can reduce consumption by 5-15 percent through awareness alone without any physical changes to your home. The In-Home Display or IHD shows your current electricity usage in real time, measured in watts and pence per hour. Watching the IHD while turning appliances on and off reveals which devices consume the most electricity. Many households discover surprising energy vampires like old freezers, fish tanks, and devices on standby that consume significant electricity continuously. The IHD also shows daily and weekly spending totals that help you track progress toward your consumption reduction goals. Smart meter data is transmitted to your supplier automatically, eliminating estimated bills and ensuring you pay only for what you use. Before smart meters, estimated bills frequently overcharged customers for months before a manual reading corrected the balance. With smart meters, your bill reflects actual consumption every month. Half-hourly consumption data from your smart meter is available through your supplier app or the national Smart Energy GB portal. This granular data shows exactly when you use the most electricity, helping you identify opportunities to shift usage to cheaper off-peak periods if you switch to a time-of-use tariff. Some suppliers offer smart time-of-use tariffs that use half-hourly data to offer different rates throughout the day. Octopus Energy Agile tariff varies the rate every 30 minutes based on wholesale prices, sometimes dropping to zero or even negative during periods of high renewable generation. Octopus Tracker follows a daily wholesale price with a markup. These tariffs reward customers who can shift consumption to cheap periods and penalize those who use heavily during expensive peak hours. Home energy monitoring systems like the Loop and Hugo provide more detailed analysis than the standard IHD. These devices connect to your smart meter data and provide appliance-level consumption breakdown, personalized saving recommendations, and comparison with similar homes. Loop is free to use and available to any UK household with a smart meter.
Future of UK Electricity Prices: 2026-2030 Outlook
UK electricity prices are influenced by global gas prices, domestic renewable capacity growth, grid investment needs, and government energy policy. Understanding these trends helps you make informed decisions about long-term investments like solar panels, heat pumps, and home batteries. Wholesale electricity prices are expected to remain volatile but trend gradually downward through the late 2020s as new offshore wind capacity comes online. The UK has committed to 50 GW of offshore wind by 2030, up from approximately 15 GW in 2026. This massive increase in zero-marginal-cost generation will reduce wholesale prices during windy periods and increase the price spread between windy and calm conditions. Network investment charges will increase as the grid adapts to support more renewable generation and increased demand from EV charging and heat pump deployment. The National Grid ESO estimates that £54 billion in transmission investment is needed by 2030 to connect offshore wind farms and reinforce the network. These costs will flow through to consumer bills as network charges, potentially adding 2-4p per kWh by 2030 if costs are not managed carefully. The government is developing reforms to the retail electricity market that would reduce the impact of gas prices on electricity bills. Proposals include splitting the electricity market into separate markets for firm power and renewable power, and potentially introducing a Green Power Pool that would pass through cheap renewable electricity to consumers at cost. These reforms could reduce average retail electricity prices by 5-15 percent if implemented successfully. EV charging load growth will increase total UK electricity demand by 20-30 percent by 2030, driven by the phase-out of new petrol and diesel car sales. This additional demand provides revenue to support grid investment but also creates peak demand challenges on local networks that may require smart charging mandates and time-of-use tariffs to manage. Heat pump deployment under the government target of 600,000 installations per year will shift heating demand from gas to electricity, further increasing electricity consumption while reducing gas consumption. For individual households, the long-term trend supports investment in generation and storage. Solar panels lock in free electricity regardless of future retail prices. Home batteries capture increasing value from price volatility. Heat pumps reduce total energy costs by using electricity 3-4 times more efficiently than gas for heating. Each of these investments becomes more valuable if retail electricity prices increase, providing a hedge against future price uncertainty.