Solar Panel Output UK by Region 2026: kWh Generation Map

Solar panel output in the UK varies by 25-35% between the sunniest and cloudiest regions. A 4kWp system in the south of England generates 3,800-4,200 kWh/year while the same system in northern Scotland produces 2,800-3,200 kWh/year. This guide maps expected output across every UK region, helping you calculate accurate savings and payback for your specific location.
Solar Output by UK Region: The Complete Map
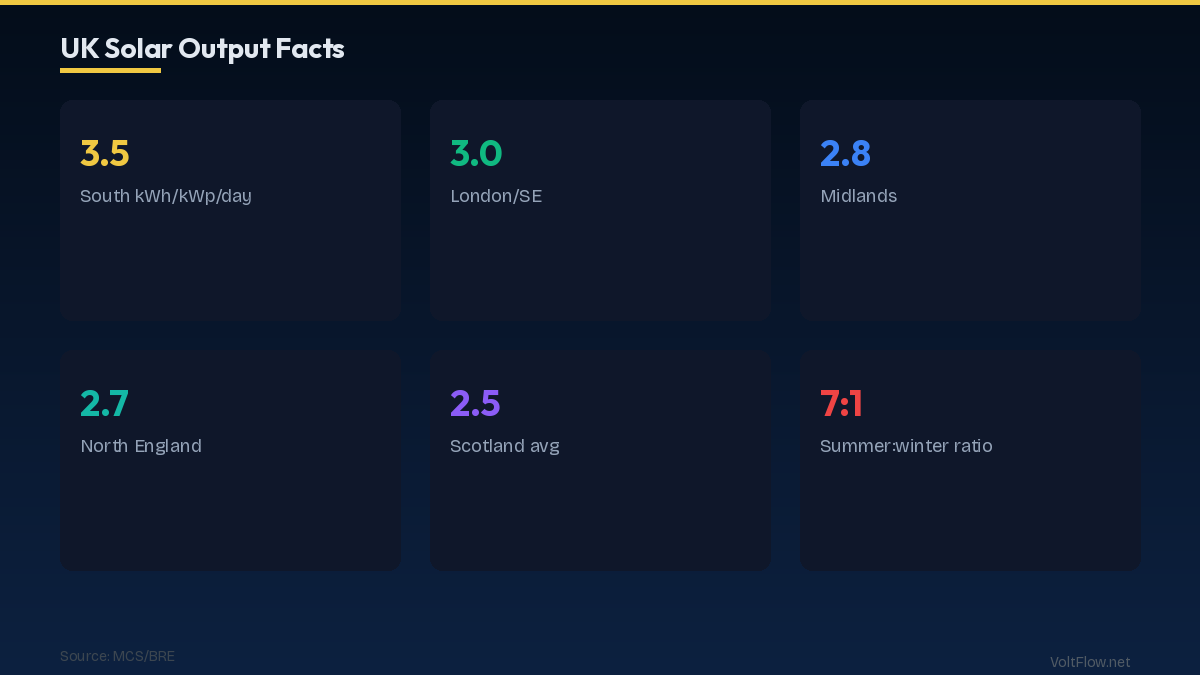
Solar panel output is measured in kilowatt-hours per kilowatt-peak installed (kWh/kWp/year). This metric allows comparison across system sizes, a location producing 900 kWh/kWp generates 3,600 kWh from a 4 kWp system or 5,400 kWh from a 6 kWp system. South West England including Cornwall, Devon, and Somerset leads the UK at 950-1,050 kWh/kWp/year. The region benefits from being the furthest south in mainland Britain, has a mild maritime climate with relatively low cloud cover, and receives the most direct sunlight hours. A 4 kWp system generates approximately 3,800-4,200 kWh annually. South East England including Kent, Sussex, and Surrey produces 900-1,000 kWh/kWp/year. Proximity to the continent brings slightly more cloud than the South West but still excellent solar conditions. London and the Thames Valley sit within this band at approximately 920 kWh/kWp. East Anglia and the East Midlands produce 880-950 kWh/kWp/year. The relatively flat terrain and lower rainfall than western regions provide good solar conditions. Norfolk and Suffolk perform particularly well due to their easterly position catching morning sun. South Wales produces 870-950 kWh/kWp/year, comparable to central England. The Midlands and central England average 850-920 kWh/kWp/year. Birmingham sits at approximately 870 kWh/kWp. Northern England including Yorkshire, Lancashire, and the North East averages 800-880 kWh/kWp/year. Manchester and Leeds sit at approximately 840 kWh/kWp. Newcastle produces approximately 820 kWh/kWp. North Wales averages 830-900 kWh/kWp/year depending on elevation and coastal influence. Scottish Lowlands including Edinburgh and Glasgow produce 780-860 kWh/kWp/year. Edinburgh at approximately 830 kWh/kWp performs slightly better than Glasgow at 800 kWh/kWp due to its eastern, drier position. Scottish Highlands and Islands produce 700-800 kWh/kWp/year. The shorter winter days at higher latitudes reduce annual output, though long summer days partially compensate. Inverness produces approximately 760 kWh/kWp. Northern Ireland averages 790-870 kWh/kWp/year, comparable to northern England. Belfast produces approximately 830 kWh/kWp. These figures assume south-facing panels at optimal tilt angle of 30-40 degrees with no shading. Actual output varies with roof orientation, tilt, shading, panel quality, and inverter efficiency.
Factors Affecting Solar Output Beyond Location
While geographic location determines the available solar resource, several installation-specific factors modify the actual output you achieve. Understanding these factors helps you set realistic expectations and optimise your system design. Roof orientation has the largest impact after location. True south-facing panels produce 100% of potential output. South-east and south-west facing panels produce 95-97%, a negligible reduction. East or west facing panels produce 80-86% of south-facing output because they miss either morning or afternoon sun. North-facing panels produce only 50-65% and are generally not recommended unless no other option exists. For east-west split installations where panels face both directions, the combined output is approximately 85-90% of south-facing equivalent, which is acceptable and often necessary when roof space is limited. Roof pitch affects seasonal production balance. A 30-35 degree pitch maximises annual output in the UK by balancing summer and winter sun angles. Flatter pitches of 10-20 degrees produce more in summer but less in winter, while steeper pitches of 40-50 degrees produce more in winter but less in summer. The variation is approximately 5-10% between optimal and sub-optimal pitch angles, so roof pitch is less critical than orientation. Flat roofs use tilted mounting frames at 15-20 degrees to improve output while minimising visual impact and wind loading. Shading from trees, chimneys, neighbouring buildings, and satellite dishes significantly reduces output. Even partial shading on one panel in a string can reduce the output of the entire string by 20-50% because the shaded panel acts as a bottleneck for current flow. Microinverters or power optimizers at each panel mitigate shading impact by allowing each panel to produce independently. A shade analysis during the design survey identifies potential obstructions throughout the year, as winter sun sits lower and creates longer shadows than summer sun. Panel quality and degradation affect output over the system lifetime. Tier 1 panels from brands like JA Solar, Trina, Longi, Canadian Solar, and REC produce within 0-3% of their rated output when new. Annual degradation of 0.4-0.6% reduces output to approximately 85-90% of original after 25 years. Budget panels may degrade faster at 0.7-1% per year and produce further below rated output when new. The 5-10% output difference between premium and budget panels over 25 years compounds to a significant difference in total generation and financial return.
Financial Return by Region: Savings and Payback
Solar financial return varies by region because both output and electricity rates differ across the UK. The combination of local generation and local costs determines your specific payback period and lifetime savings. South West England with 4,000 kWh annual output from a 4 kWp system at self-consumption rate of 40% and SEG export rate of 12p per kWh: annual savings equal (1,600 kWh times £0.245) plus (2,400 kWh times £0.12) equals £392 plus £288 equals £680. At system cost of £5,500, payback is 8.1 years. Lifetime 25-year savings approximately £15,000. London and South East with 3,700 kWh output: annual savings of £628. Payback of 8.8 years. Lifetime savings £13,800. Midlands with 3,500 kWh output: annual savings of £594. Payback of 9.3 years. Lifetime savings £13,000. Northern England with 3,300 kWh output: annual savings of £560. Payback of 9.8 years. Lifetime savings £12,200. Edinburgh with 3,320 kWh output: annual savings of £563. Payback of 9.8 years. Lifetime savings £12,300. Glasgow with 3,200 kWh output: annual savings of £543. Payback of 10.1 years. Lifetime savings £11,800. These calculations use conservative assumptions. Self-consumption can be increased to 60-80% with a battery, significantly improving returns. Electricity rate increases averaging 2-3% per year increase the value of each kWh generated, improving actual returns beyond these projections. Solar panel prices in the UK have stabilised at £5,000-£7,000 for a standard 4 kWp system and £7,000-£10,000 for a 6 kWp system, both including VAT at 0% for domestic installations. Larger systems of 8-10 kWp for larger homes or EV owners cost £9,000-£14,000. All systems qualify for SEG export payments and the 0% VAT rate that applies to solar panels and associated battery storage.
Seasonal Output Variation: Summer vs Winter
UK solar output follows an extreme seasonal pattern that affects both the amount of electricity generated and when it is available. Understanding this pattern helps you set realistic expectations and plan your energy strategy for the whole year. Summer months from May to August produce 55-65% of total annual output. A 4 kWp south-facing system generates 15-22 kWh per day during June and July, peaking at 25+ kWh on the longest, clearest days. This substantially exceeds the average household daily consumption of 7-8 kWh, creating large surpluses for export or battery storage. Winter months from November to February produce only 8-12% of annual output. The same system generates just 2-5 kWh per day during December and January, with some overcast days producing less than 1 kWh. This falls well short of household needs, requiring grid import to cover the deficit. Transition months of March-April and September-October produce the remaining 25-35% of annual output with daily generation of 8-15 kWh, roughly matching household consumption and providing the most balanced self-consumption. The seasonal variation means that a solar system sized to cover annual consumption will massively overproduce in summer and substantially underproduce in winter. A battery helps smooth this daily cycle by storing daytime surplus for evening use, but cannot bridge the seasonal gap without being impractically large. The practical approach is to accept the seasonal pattern, export surplus in summer for SEG income, and import from the grid in winter. Smart tariff integration helps manage winter costs by charging overnight at cheap rates. A 4 kWp system in the South East produces approximately 650-700 kWh in June but only 80-120 kWh in December, a 6:1 ratio between best and worst months. Planning your highest electricity usage for summer months such as running the tumble dryer, doing extra laundry, and charging the EV during long sunny days maximises self-consumption when solar is most abundant.
Optimising Your Solar System for UK Conditions
Maximising financial return from a UK solar installation requires thoughtful system design, smart consumption management, and the right tariff and export arrangements. Choose the right system size for your consumption. Oversizing beyond your annual consumption provides diminishing returns because excess generation earns only the SEG rate of 4-15p per kWh rather than offsetting imports at 24.5p. A system that generates 90-110% of your annual consumption maximises the financial return. For EV owners, size the system to cover both household and EV charging consumption since the EV effectively increases your self-consumption capacity by 3,000-5,000 kWh per year. Select the best SEG tariff for your export pattern. SEG rates vary from 1p to 15p per kWh. Octopus Energy typically offers 12-15p per kWh on their SEG tariff. Social Energy and other specialists offer competitive rates. Compare SEG tariffs separately from your import tariff, you can have different suppliers for import and export to get the best of both. Consider a battery to shift self-consumption from 30-40% to 60-80%. Without a battery, most of your solar generation occurs when you are at work and the house is empty, forcing export at the lower SEG rate. A battery captures this midday surplus and releases it during the evening when you are home using electricity. The value gain of 10-20p per kWh shifted multiplied by 2,000-3,000 kWh per year produces £200-£600 in additional annual savings, improving the combined solar-plus-battery return. Monitor your system performance using the inverter monitoring app. Compare actual output against the regional expectations in this guide. If your system consistently underperforms by more than 10-15%, investigate potential issues such as partial shading from tree growth, panel soiling from bird droppings or pollution, inverter faults reducing output, or a single panel failure dragging down string performance. Annual output should remain within 5% of the expected value for the first 5 years, declining slowly thereafter at the panel degradation rate of 0.4-0.6% per year. Significant underperformance indicates a fixable problem that is costing you money every sunny day it remains unresolved.

Solar Panels in Northern Scotland: Still Worth It?
The question of whether solar panels are worth installing in northern Scotland, where annual output is 20-30% lower than southern England, is one of the most common questions from Scottish homeowners. The answer is yes for most properties, with some important caveats. A 4 kWp system in Inverness generating 3,040 kWh per year at self-consumption rate of 40%: annual savings equal (1,216 times £0.245) plus (1,824 times £0.12) equals £298 plus £219 equals £517. At system cost of £5,500, payback is 10.6 years, longer than in the south but still well within the 25-year panel warranty period. Lifetime savings of approximately £11,000 remain substantial. The extreme seasonal variation in northern Scotland is both a challenge and an opportunity. Summer days in Inverness last 18-19 hours in June, with useful solar generation from 5 AM to 10 PM. A well-oriented 4 kWp system can generate 20-25 kWh on a clear June day, comparable to southern England because the longer day compensates for the lower sun angle. Winter is the challenge, with only 6-7 hours of weak daylight in December producing minimal solar output. This extreme seasonality makes batteries less cost-effective in northern Scotland because the daily surplus to store is concentrated in just 4-5 months rather than spread across 8-9 months as in southern England. A battery might cycle fully during June but sit nearly empty during December. However, if you combine the battery with overnight tariff arbitrage year-round, the economics improve by providing winter value from the tariff spread even when solar generation is minimal. Scottish homeowners benefit from the same 0% VAT and SEG export payments as the rest of the UK. Some Scottish-specific incentive programs through Home Energy Scotland provide additional support for renewable installations. The Scottish government commitment to net zero by 2045 has driven supportive policies for domestic solar adoption. For Scottish homeowners, the decision often comes down to whether the 10-11 year payback period is acceptable given their plans for the property. If you expect to remain in the home for 10+ years, the lifetime savings of £10,000-£12,000 on a £5,500 investment represent an excellent return by any financial measure. If you plan to move within 5 years, the solar panels add value to the property but may not deliver full payback during your ownership.