Solar Panel Output Australia by City 2026: kWh Generation Guide

Solar panel output across Australia ranges from 1,300 kWh/kWp in Hobart to 1,800 kWh/kWp in Darwin, a 38% variation that significantly affects system sizing, payback periods, and annual savings. A standard 6.6kWp system generates 8,600-11,900 kWh per year depending on your city. This guide maps expected output for every major Australian city to help you calculate accurate savings for your specific location.
Solar Output by Australian Capital City
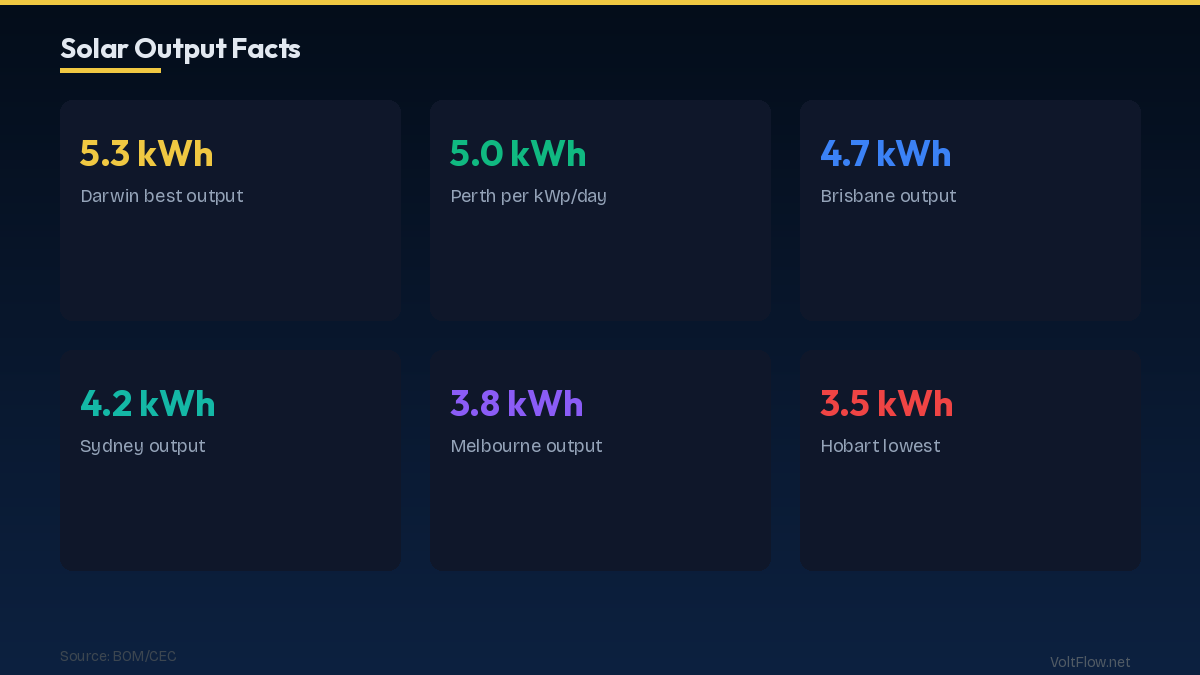
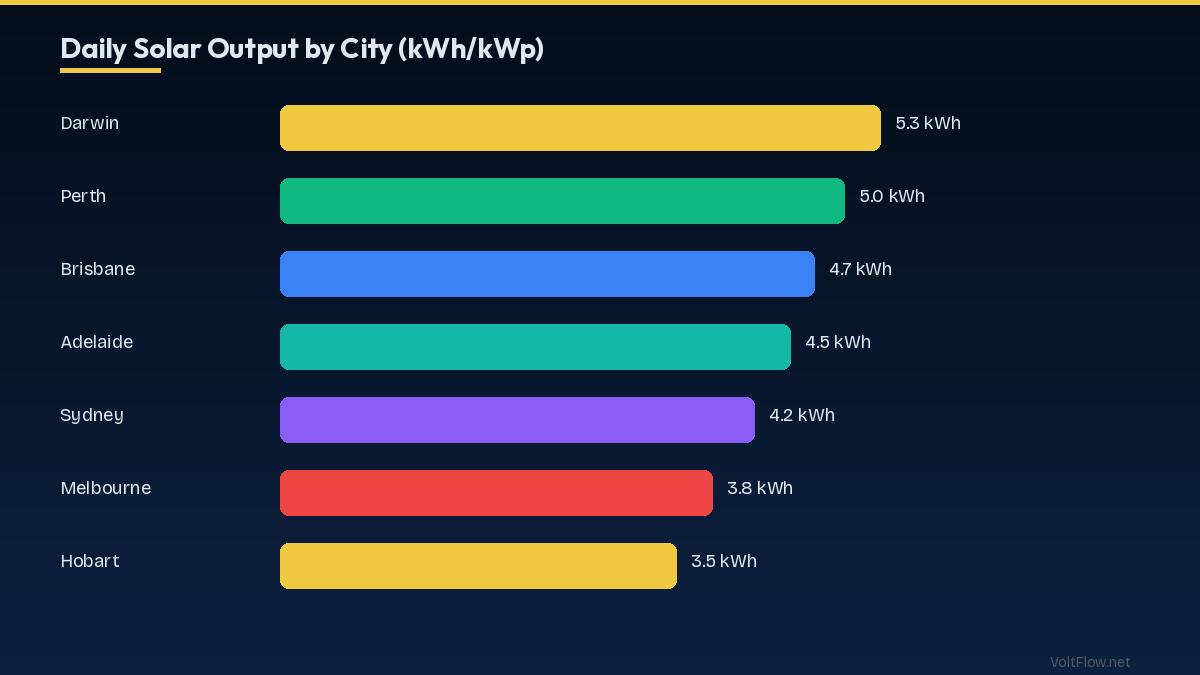
Solar panel output is measured in kilowatt-hours per kilowatt-peak installed per year (kWh/kWp/year). This standardised metric allows comparison across system sizes. Multiply by your system size to get annual generation. Darwin leads Australia at approximately 1,700-1,800 kWh/kWp/year due to its tropical latitude and dry season providing intense, consistent sunshine. A 6.6 kWp system generates approximately 11,200-11,900 kWh per year. However, the wet season from November to April brings cloud cover and humidity that reduces output significantly below the dry season peak. Brisbane produces approximately 1,550-1,650 kWh/kWp/year. The subtropical climate provides excellent year-round solar resource with mild winters that maintain reasonable output even in June and July. A 6.6 kWp system generates 10,200-10,900 kWh per year. Perth produces approximately 1,550-1,650 kWh/kWp/year, matching Brisbane despite its higher latitude. The Mediterranean climate with very dry, sunny summers and mild winters delivers consistent high output. A 6.6 kWp system generates 10,200-10,900 kWh per year. Perth has among the highest solar penetration rates in the world. Adelaide produces approximately 1,450-1,550 kWh/kWp/year. Hot, dry summers provide peak output while mild winters maintain reasonable generation. A 6.6 kWp system generates 9,600-10,200 kWh per year. SA high electricity rates mean Adelaide solar systems have the fastest payback in Australia despite not having the highest output. Sydney produces approximately 1,400-1,500 kWh/kWp/year. The temperate climate with warm summers and mild winters provides good year-round output. Coastal humidity reduces output slightly compared to inland areas at the same latitude. A 6.6 kWp system generates 9,200-9,900 kWh per year. Canberra produces approximately 1,450-1,550 kWh/kWp/year, slightly higher than Sydney due to clearer inland skies and lower humidity despite colder winters. The altitude of 580 metres provides slightly thinner atmosphere and more intense sunlight. A 6.6 kWp system generates 9,600-10,200 kWh per year. Melbourne produces approximately 1,300-1,400 kWh/kWp/year, the lowest of the mainland capitals. The temperate maritime climate with more cloud cover, particularly during winter, reduces annual output. A 6.6 kWp system generates 8,600-9,200 kWh per year. Despite lower output, Melbourne solar still delivers strong financial returns due to competitive system pricing and reasonable electricity rates. Hobart produces approximately 1,250-1,350 kWh/kWp/year, the lowest of all capitals. The southern latitude and maritime climate provide less solar resource. A 6.6 kWp system generates 8,250-8,900 kWh per year. However, even Hobart solar systems achieve payback within 6-8 years and provide positive lifetime returns.
Regional and Rural Solar Output
Many Australian homeowners live outside capital cities where solar output can differ significantly from the nearest capital due to altitude, proximity to coast, and local climate patterns. North Queensland including Cairns, Townsville, and Mackay produces 1,600-1,750 kWh/kWp. These tropical locations rival Darwin for output during the dry season but see significant wet season reduction. The extreme heat of summer also reduces panel efficiency through temperature derating, panels on a 45-degree rooftop in Townsville can reach 75-80 degrees Celsius, losing 15-20% of rated output during peak afternoon hours. Central Australia including Alice Springs and the outback produces the highest solar output in the country at 1,800-2,000 kWh/kWp. The combination of clear skies, low humidity, and intense solar radiation makes these locations comparable to the world best solar sites. However, extreme temperatures of 40-45 degrees in summer reduce panel efficiency during the hottest hours. Regional NSW including Newcastle, Wollongong, Central Coast, and Blue Mountains produces 1,350-1,500 kWh/kWp, slightly below Sydney due to varied terrain and microclimate effects. Inland NSW locations like Dubbo, Orange, and Wagga achieve 1,450-1,550 kWh/kWp thanks to clearer continental skies. Regional Victoria including Geelong, Ballarat, Bendigo, and the Latrobe Valley produces 1,250-1,400 kWh/kWp. Coastal Gippsland sites have lower output than inland Bendigo due to marine cloud influence. South West WA including Bunbury, Margaret River, and Albany produces 1,400-1,500 kWh/kWp, lower than Perth due to increased winter rainfall but still excellent. Tasmania outside Hobart varies from 1,200 kWh/kWp in the wet west coast to 1,350 kWh/kWp in the drier east coast around Launceston. For accurate output estimates for your specific address, use the Australian PVSyst tool or the APVI Solar Map at apvi.org.au which provides location-specific solar resource data based on satellite observations averaged over 20 years.
Factors That Affect Your Actual Solar Output
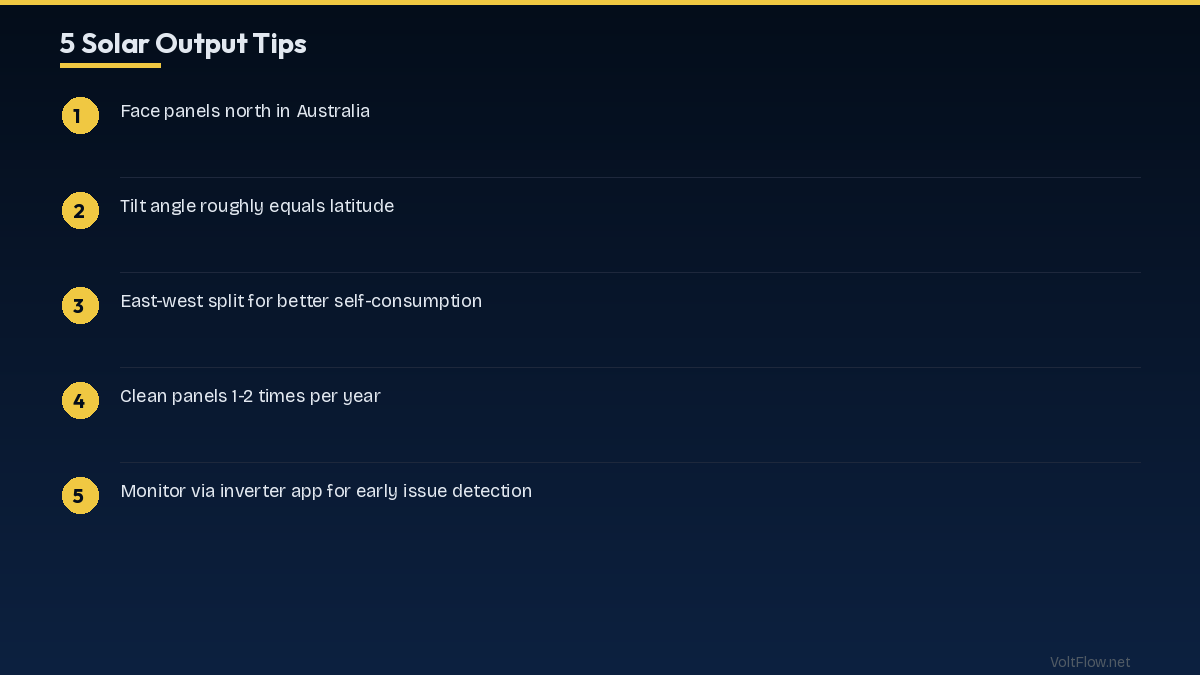
The city-average figures above assume optimal conditions: north-facing panels at the ideal tilt angle with no shading. Your actual output depends on several installation-specific factors. Roof orientation is the most significant factor after location. In Australia (Southern Hemisphere), north-facing panels produce maximum output. North-west and north-east facing panels produce 95-97% of north, a negligible difference. East or west facing panels produce 82-87% of north output. South-facing panels produce only 60-70% and are generally not recommended. For homes with only east-west facing roof space, splitting panels between east and west produces 85-90% of all-north output with the benefit of spreading generation across more of the day. Roof pitch affects seasonal balance. The optimal tilt angle for annual output in Australia is approximately equal to your latitude: 27 degrees in Brisbane, 34 degrees in Sydney, 38 degrees in Melbourne. Most Australian rooftops have pitch angles of 15-25 degrees which is slightly flatter than optimal but produces within 3-5% of maximum output. Flat roofs use tilted mounting frames, typically at 10-15 degrees to balance output with wind loading and visual impact. Shading from trees, neighbouring buildings, antennas, and roof obstructions reduces output. Even partial shading on one panel in a string of series-connected panels can reduce the entire string output by 20-50%. Microinverters or power optimisers at each panel mitigate shading impact by allowing independent panel operation. An experienced installer performs a shade analysis as part of the design survey, identifying which roof areas receive adequate sunshine throughout the year. Temperature derating is more significant in Australia than in cooler climates. Panel output decreases by 0.3-0.4% per degree Celsius above the 25-degree Standard Test Condition temperature. On a 35-degree day with panels at 60-65 degrees on the roof, output drops by 10-16% compared to STC rating. This derating is already factored into the city output figures above, which are based on real-world performance data rather than laboratory STC ratings. Panel degradation reduces output by 0.4-0.6% per year for quality tier-1 panels. After 25 years, panels produce 85-90% of their original output. Budget panels may degrade faster at 0.7-1.0% per year. Over a 25-year system life, the cumulative difference between premium and budget panel degradation is 5-15% of total lifetime generation.
Financial Return by City
Combining location-specific output with local electricity rates and system costs provides accurate financial projections for each major city. These calculations assume a 6.6 kWp system with 35% self-consumption without battery, and include both self-consumption savings and feed-in tariff income. Brisbane: 10,500 kWh annual output at 28c self-consumed rate and 8c FiT. Annual value: (3,675 kWh × A$0.28) + (6,825 kWh × A$0.08) = A$1,029 + A$546 = A$1,575. System cost after STC: A$5,000. Payback: 3.2 years. Perth: 10,500 kWh at 32c rate and DEBS scheme (10c peak export, 2.5c off-peak export). Assuming 30% of exports during 3-9 PM peak window: annual value approximately A$1,450. System cost A$5,200. Payback: 3.6 years. Adelaide: 9,800 kWh at 38c and 5c FiT. Annual value: (3,430 × A$0.38) + (6,370 × A$0.05) = A$1,303 + A$319 = A$1,622. System cost A$5,200. Payback: 3.2 years, fastest in Australia despite not having the highest output, because SA high rates make each self-consumed kWh more valuable. Sydney: 9,500 kWh at 31c and 7c FiT. Annual value: (3,325 × A$0.31) + (6,175 × A$0.07) = A$1,031 + A$432 = A$1,463. System cost A$5,500. Payback: 3.8 years. Melbourne: 8,900 kWh at 30c and 5c FiT. Annual value: (3,115 × A$0.30) + (5,785 × A$0.05) = A$935 + A$289 = A$1,224. System cost A$5,000 (with VIC rebate). Payback: 4.1 years. Hobart: 8,500 kWh at 28c and 9c FiT. Annual value: (2,975 × A$0.28) + (5,525 × A$0.09) = A$833 + A$497 = A$1,330. System cost A$5,500. Payback: 4.1 years. Tasmania higher FiT rate partially compensates for lower output. Darwin: 11,500 kWh at 28c and 8.3c FiT. Annual value: (4,025 × A$0.28) + (7,475 × A$0.083) = A$1,127 + A$620 = A$1,747. System cost A$6,000 (higher installation costs in NT). Payback: 3.4 years. All cities deliver payback well within the 25-year panel warranty, with lifetime savings of A$25,000-$40,000 per system.
Seasonal Output Variation Across Australia
Understanding seasonal output patterns helps you plan energy management, battery sizing, and tariff optimisation for maximum financial benefit throughout the year. Northern Australia including Darwin, Cairns, and Townsville has the flattest seasonal profile. Summer wet season December to March produces 25-30% less than the peak dry season months of June to September due to cloud cover and humidity. Annual variation ratio of best to worst month is approximately 1.5:1. This relatively flat profile means solar systems produce consistently throughout the year, and batteries provide value in all seasons. Brisbane and Perth have moderate seasonal variation with a best-to-worst month ratio of approximately 2:1. Summer months produce the most, but the transition seasons of autumn and spring still generate strong output. Winter produces approximately 50-60% of summer output. These cities experience the best combination of high total output and manageable seasonal variation. Sydney and Canberra have more pronounced seasonal variation at approximately 2.5:1. December and January produce peak output of 5-6 kWh per kWp per day while June and July produce only 2-2.5 kWh per kWp per day. Self-consumption rates naturally increase in winter as generation decreases toward household consumption levels, meaning less surplus is exported at the low FiT rate. Melbourne and Hobart have the most extreme seasonal variation at 3:1 or more. A 6.6 kWp system in Melbourne generates 35-40 kWh per day in December but only 10-14 kWh in June. This extreme variation means the system produces surplus for 8-9 months but falls short of household needs for 3-4 winter months, requiring grid imports at full retail rates. Battery sizing in Melbourne and Hobart should focus on the shoulder months of March-April and September-October when generation roughly matches consumption and a battery can capture and shift the daily surplus most effectively. During peak summer, the surplus exceeds any practical battery capacity and must be exported. During winter, there is little surplus to store. The battery provides maximum value during the 6-7 months between these extremes. For northern cities with flatter seasonal profiles, the battery provides more consistent value year-round because the daily surplus is more predictable and the battery fills and discharges in a regular pattern across all seasons.
Maximising Output from Your Australian Solar System
Several practical strategies increase your actual solar output beyond the city-average figures, some requiring investment and others requiring only maintenance and monitoring. Panel cleaning provides a measurable output increase in Australian conditions where dust, pollen, bird droppings, and coastal salt film accumulate on panels. Studies show Australian panels lose 3-8% of output from soiling, with higher losses in dry inland areas and coastal locations. Cleaning panels twice per year, once before summer and once before winter, recovers this lost output. Professional panel cleaning costs A$100-$200 per visit for a typical residential system. DIY cleaning with a garden hose and soft brush in the early morning when panels are cool is effective and free. Never clean panels in direct midday sun as thermal shock from cold water on hot glass can cause microcracking. Inverter monitoring through your solar monitoring app reveals output trends that indicate potential problems. A sudden drop in output suggests a fault such as a tripped inverter, a failed panel, or shading from new tree growth. A gradual decline beyond normal degradation may indicate soiling, wiring deterioration, or inverter aging. Check your monitoring app monthly and compare current output to the same month in previous years. Any decline exceeding 5% year-on-year warrants investigation. Tree management around your property maintains unobstructed solar access. Trees grow 30-60 cm per year in Australian conditions, and a tree that did not shade your panels when installed may grow to cast shadows within 3-5 years. Regular pruning of trees on your property is your responsibility. Trees on neighbouring properties that grow to shade your panels are more complex, speak with your neighbour and check your local council regulations about solar access rights and tree trimming rules. Panel orientation optimisation using tilt frames on flat roofs or ground-mount systems allows you to angle panels for maximum output rather than being constrained by roof pitch. The additional cost of A$500-$1,500 for tilt frames is justified if your roof pitch is significantly different from optimal for your latitude. Ground-mount systems at A$2,000-$5,000 for the mounting structure provide optimal orientation and tilt but require suitable ground space and council approval in most jurisdictions.